Question 1.
For which of these would you use a histogram to show the data?
- (a) The number of letters for different areas in a postman’s bag.
- (b) The height of competitors in an athletics meet.
- (c) The number of cassettes produced by 5 companies.
- (d) The number of passengers boarding trains from 7:00 a.m. to 7:00 p.m at a station.
Give reasons for each.
Solution.
For (b) and (d) because in these two cases data can be grouped into class intervals.
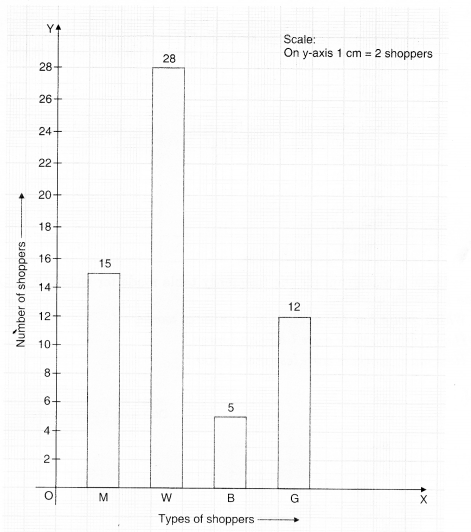
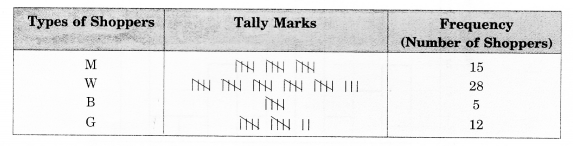
Question 2.
The shoppers who come to a departmental store are marked as man (M), woman (W), boy (B) or girl (G). The following list gives the shoppers who came during the first hour in the morning.
WWWGBWWMGGMMWWWWG
BMWBGGMWWMMWW
WMWBWGMWWWWGWMMWW
MWGWMGWMMBGGW
Make a frequency distribution table using tally marks. Draw a bar graph to illustrate it.
Solution.
Question 3.
The weekly wages (in of 30 workers in a factory are:
830, 835, 890, 810, 835, 836, 869, 845, 898, 890, 820, 860,
832, 833, 855, 845, 804, 808, 812, 840, 885, 835, 835, 836,
878, 840, 868, 890, 806, 840.
Solution.
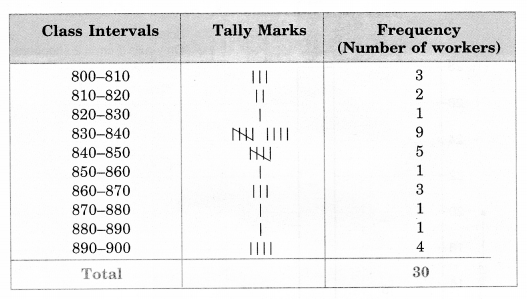
Question 4.
Draw a histogram for the frequency table made for the data in Question 3, and answer the following questions:
- (i) Which group has the maximum number of workers?
- (ii) How many workers earnt 850 and more?
- (iii) How many workers earn less than? 850?
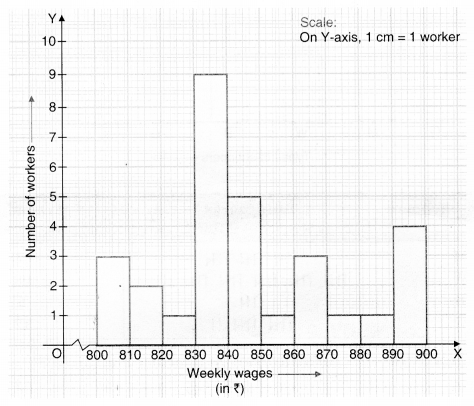
- (i) Group 830—840, has the maximum number of workers.
- (ii) 1 + 3 + 1 + 1 + 4 = 10, workers earn ? 850 and more.
- (iii) 3 + 2 + l + 9 + 5 = 20, workers earn less than ? 850.
Question 5.
The number of hours for which students of a particular class watched television during holidays is shown through the given graph:
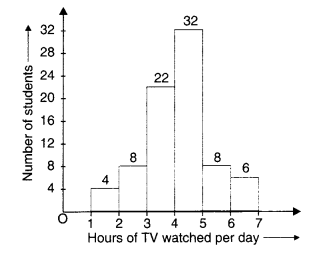
Answer the following:
- (i) For how many hours did the maximum number of students watch TV?
- (ii) How many students watched TV for less than 4 hours?
- (iii) How many students spent more than 5 hours watching TV?
Solution.
- (i) The maximum number of students watch TV for 4 to 5 hours.
- (ii) 4 + 8 + 22 = 34 students watch TV for less than 4 hours.
- (iii) 8 + 6 = 14 students spend more than 5 hours in watching TV.
Chapter 5 Data Handling Ex 5.2
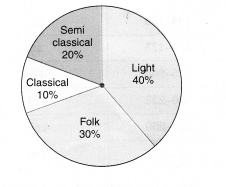
Question 1.
A survey was made to find the type of music that a certain group of young people liked in a city. The adjoining pie chart shows the findings of this survey.
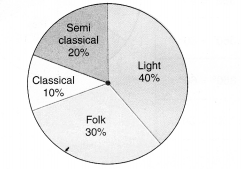
From this pie chart answer the following:
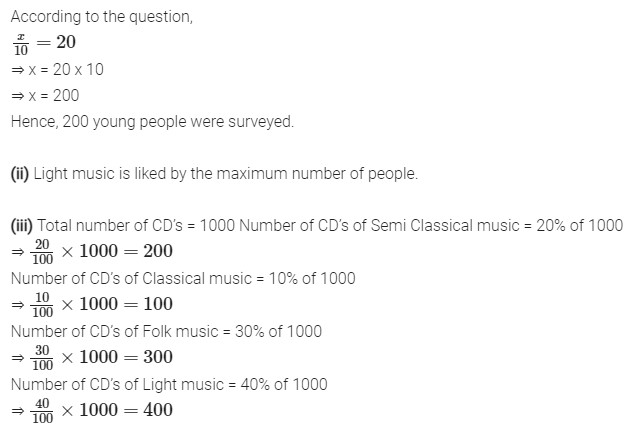
- (i) If 20 people liked classical music, how many young people were surveyed?
- (ii) Which type of music is liked by the maximum number of people?
- (iii) If a cassette company were to make 1000 CD’s, how many of each type would they make?
Solution.
(i) Suppose that x young people were surveyed. Then, the number of young people who liked classical music = 10% of x
10/100×x=x/10
Question 2.
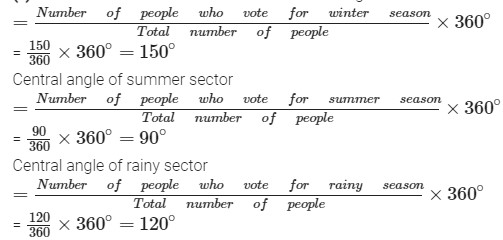
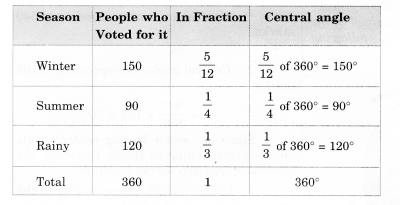
A group of 360 people was asked to vote for their favorite season from the three seasons rainy, winter and summer.
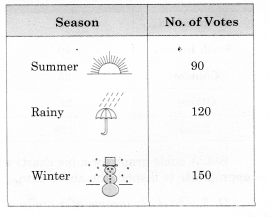
(i) Which season got the most votes?
(ii) Find the central angle of each sector.
(iii) Draw a pie chart to show this information.
Solution.
(i) Winter season got the most votes.
(ii) Total votes = 90 + 120 + 150 = 360. Central angle of winter sector
(iii)

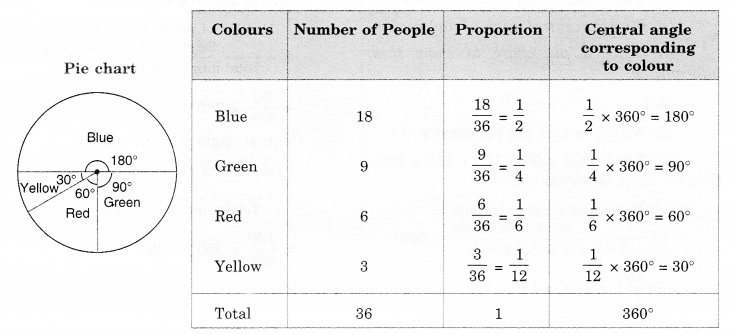
Question 3.
Draw a pie chart showing the following information. The table shows the colors preferred by a group of people.
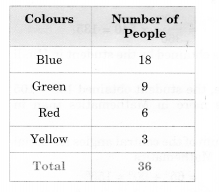
Find the proportion of each sector. For example, Blue is 18/36=1/2 ; Green is 9/36=1/4 ; and so on. Use this to find the corresponding angles.
Solution.
Question 4.
The adjoining pie chart gives the marks scored in an examination by a student in Hindi, English, Mathematics, Social Science and Science. If the total marks obtained by the students were 540, answer the following questions.
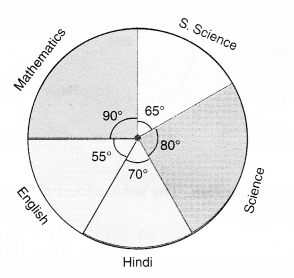
(i) In which subject did the student score 105 marks?
(Hint: For 540 marks, the central angle = 360°. So, for 105 marks, what is the central angle ?)
(ii) How many more marks were obtained by the student in Mathematics than in Hindi?
(iii) Examine whether the sum of the marks obtained in Social Science and Mathematics is more than that in Science and Hindi.
(Hint; Just study the central angles).
Solution.
(i) Total marks = 540
? Central angle corresponding to 540 = 360?
∴ Central angle corresponding to 105
360?/540×(105)=70?
Since the sector having central angle 70° is corresponding to Hindi, therefore, the student scored 105 marks in Hindi.
(ii) Central angle corresponding to the sector of Mathematics = 90°
∴ Marks obtained by the student in Mathematics
90?/360?×540=135.
Marks obtained by the student in Hindi = 105.
Hence, the student obtained 135 – 105 = 30 marks more in Mathematics than in Hindi.
(iii) Sum of the central angles for Social Science and Mathematics
= 65° + 90° = 155°
Sum of the central angles for Science and Hindi
= 80° + 70° = 150°
Since the marks obtained are proportional to the central angles corresponding to various subjects and 155°
> 150°, therefore the sum of the marks obtained in Social Science and Mathematics is more than that in Science and Hindi.
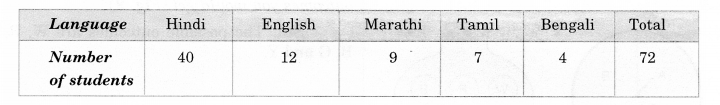
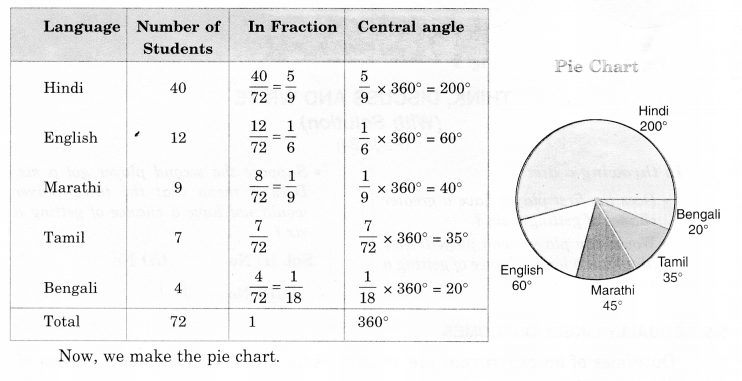
Question 5.
The number of students in a hostel, speaking different languages is given below. Display the data in a pie chart.
Solution
Chapter 5 Data Handling Ex 5.3
Question 1.
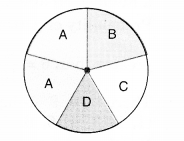
List the outcomes you can see in these experiments.
(a) Spinning a wheel
(b) Tossing two coins together
Solution.
(a) Outcomes in spinning the given wheel are A, B, C and D.
(b) Outcomes in tossing two coins together are HT, HH, TH, TT (Here HT means Head on first coin and Tail on the second coin and so on).
Question 2.
When a die is thrown, list the outcomes of an event of getting
- (i)
- (a) a prime number
- (b) not a prime number
- (ii)
- (a) a number greater than 5
- (b) a number not greater than 5.
Solution.
Possible outcomes are:
1, 2, 3, 4, 5, and 6.
Out of these, prime numbers are
2, 3 and 5.
- (i)
- (a) Outcomes of an event of getting a prime number are: 2, 3 and 5
- (b) Outcomes of an event of not getting a prime number are 1, 4 and 6.
- (ii)
- (a) Outcomes of an event of getting a number greater than 5 are 6
- (b) Outcomes of an event of getting a; number not greater than 5 are 1, 2, 3, 4 and 5.
Question 3.
Find the
- (a) Probability of the pointer stopping on D in (Question l-(a))?
- (b) Probability of getting an ace from a j well shuffled deck of 52 playing cards?
- (c) Probability of getting a red apple. (See figure)
Solution.
(a) There are in all 5 outcomes of the event. These are A, B, C and D. The pointer stopping on D has only 1 outcome, i.e., D
∴ Probability of the pointer stopping on D=1/5
(b) Total number of playing cards = 52 Number of possible outcomes = 52
Number of aces in a deck of playing cards = 4
cards = 4
∴ Probability of getting an ace from a well shuffled deck of 52
playing cards = 45/2 = 1/13
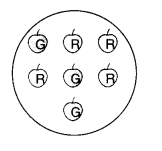
(c) Total number of apples = 7
Number of red apples = 4
∴ Probability of getting a red apple = 47
Question 4.
Numbers 1 to 10 are written on ten separate slips (one number on one slip), kept in a box and mixed well. One slip is chosen from the box without looking into it. What is the probability of?
- (i) getting a number 6?
- (ii) getting a number less than 6?
- (iii) getting a number greater than 6?
- (iv) getting a 1-digit number?
Solution.
Total number of outcomes of the event (1, 2, 3, 4, 5, 6, 7, 8, 9 and 10) = 10
(i)
? Number of outcomes of getting a number 6=1
? Probability of getting a number 1/10
(ii)
? There are 5 numbers (1, 2, 3, 4 and 5) less than 6.
? Number of outcomes of getting a number less than 6 = 5
? Probability of getting a number less than 6= 5/10= 1/2
(iii)
? There are 4 numbers (7, 8, 9 and 10) greater than 6
? Number of outcomes of getting a number greater than 6 = 4
? Probability of getting a number greater than 6= 4/10=2/15
(iv)
? There are 9 1-digit numbers (1, 2, 3, 4, 5, 6, 7, 8 and 9)
∴ Number of outcomes of getting a 1-digit number = 9
∴ Probability of getting a 1-digit number =9/10
Question 5.
If you have a spinning wheel with 3 green sectors, 1 blue sector and 1 red sector, what is the probability of getting a green sector? What is the probability of getting a nonblue sector?
Solution.
Number of green sectors = 3
Number of blue sectors = 1
Number of red sectors = 1
∴ Total number of sectors = 3 + 1 + 1=5
∴ Total number of outcomes of the event = 5
Number of outcomes of getting a green sector = 3
∴ Probability of getting a green sector = 3/5
Number of outcomes of getting a non-blue sector = Number of green sectors + Number of red sectors
=3+1=4
∴ Probability of getting a non-blue sector = 4/5.
Question 6.
Find the probabilities of the events given in Question 2.
Solution.
Total number of outcomes of the event (1, 2, 3, 4, 5 and 6) = 6
(i)
(a) Number of prime numbers (2, 3 and 5) = 3
∴ Number of outcomes of getting a prime number = 3
∴ Probability of getting a prime number =3/6=1/2.
(b) Number of non-prime numbers (1, 4 and 6) = 3
∴ Number of outcomes of getting a non-prime number = 3
∴ Probability of getting a non-prime number =3/6=1/2.
(ii)
(a) Number greater than 5 = 6, i.e., only one.
∴ Number of outcomes of getting a number greater than 5 = 1
∴ Probability of getting a number greater than 5 =1/6.
(b) Number of numbers not greater than 5 (1, 2, 3, 4 and 5) = 5
∴ Number of outcomes of getting a number not greater than 5 = 5
∴ Probability of getting a number not greater than 5 =5/6.